1. Introduction
Forests across Sub-Saharan Africa underpin a wide range of ecological and socioeconomic functions, including climate regulation, biodiversity conservation, watershed stabilization, carbon storage, and the provision of wood and non-wood forest products. These forests form the backbone of rural livelihoods and national economies, yet they are increasingly threatened by anthropogenic pressures and climate variability
| [1] | Ayanlade, A., and M. O. Jegede, Climate variability and change in Sub-Saharan Africa: Impacts, vulnerability and policy implications. Environmental Sustainability, 2020. 3: 27–42. https://doi.org/10.1007/s42398-020-00096-8 |
| [2] | FAO, State of the World’s Forests 2022: Forest pathways for green recovery and building inclusive, resilient and sustainable economies. Rome: Food and Agriculture Organization of the United Nations, 2022. https://doi.org/10.4060/cb9360en |
[1, 2]
. Illegal logging, charcoal production, agricultural expansion, encroachment, and unregulated extraction continue to drive forest degradation across the region. In addition, climate-amplified fire regimes, prolonged droughts, pest outbreaks, and shifting rainfall patterns are compounding these pressures, reducing forest resilience and increasing the cost of monitoring and enforcement
. As a result, forest agencies are under growing pressure to adopt more adaptive, data-driven, and cost-effective management systems.
Kenya has responded to these challenges through a robust constitutional and statutory framework for forest governance. The Constitution of Kenya (2010) and the Forest Conservation and Management Act (2016) anchor contemporary efforts toward sustainable forest management, emphasizing devolved governance, community participation, and evidence-based decision-making. These policies outline ambitious national targets—initially 10% national tree cover by 2030, now escalated toward 30% by 2032 under the national climate and restoration agenda
| [4] | Republic of Kenya, The Constitution of Kenya, 2010. Nairobi: National Council for Law Reporting, 2010. |
| [5] | Republic of Kenya, Forest Conservation and Management Act, 2016. Nairobi: National Council for Law Reporting, 2016. |
[4, 5]
. Achieving these targets requires timely, accurate, and spatially granular information to detect forest disturbances, guide interventions, and evaluate restoration progress. Traditional monitoring techniques—such as periodic patrols, manual inventory, and visual inspections—are often slow, labor-intensive, and constrained by limited staffing and vast forest extents. This has created a strong incentive for the adoption of smart forestry solutions.
Digital transformation has emerged as a game-changing frontier in forest governance globally and within Kenya. Advancements in Earth Observation (EO) analytics, mobile Geographic Information Systems (GIS), near-real-time dashboards, cloud computing, and low-cost drones have significantly enhanced forest managers’ ability to detect disturbances early, verify incidents rapidly, and coordinate responses efficiently
| [6] | Jha, C. S., S. Rodda, and K. C. Thumaty, Advances in satellite-based monitoring for forest governance. Remote Sensing Applications: Society and Environment, 2021. 24: 100611.
https://doi.org/10.1016/j.rsase.2021.100611 |
| [7] | Hansen, M. C., A. Krylov, A. Kommareddy, A. Tyukavina, P. V. Potapov, and S. Turubanova, Humid tropical forest disturbance alerts using Landsat data. Environmental Research Letters, 2016. 11(3): 034008.
https://doi.org/10.1088/1748-9326/11/3/034008 |
[6, 7]
. Optical and Synthetic Aperture Radar (SAR) data fusion has improved all-weather detection, mitigating challenges posed by cloud cover in tropical regions
| [8] | Tang, X., Y. Wang, X. Li, and J. Dong, Optical–SAR fusion for near-real-time forest disturbance monitoring: A systematic review. Remote Sensing, 2023. 15(4): 935.
https://doi.org/10.3390/rs15040935 |
[8]
. These tools reduce the “information-to-action” delay that has historically undermined enforcement, enabling agencies to shift from reactive to proactive forest protection models.
At the same time, international research increasingly recognizes the value of integrating community participation into digital monitoring systems. Community Forest Associations (CFAs), forest-adjacent households, and indigenous communities often generate high-quality contextual information that satellites cannot detect, such as vehicle movement, tree marking, suspicious activities, or illegal charcoal kilns concealed under canopy
| [9] | Alix-Garcia, J., E. McIntosh, K. Sims, and J. Welch, Community monitoring and forest outcomes under payments for ecosystem services. Proceedings of the National Academy of Sciences, 2021. 118(3): e2017322118.
https://doi.org/10.1073/pnas.2017322118 |
[9]
. Digital tools that incorporate community reporting—through mobile applications, structured forms, or geo-tagged submissions—have been found to enhance deterrence, improve local legitimacy, and strengthen co-management outcomes in Africa, Latin America, and Southeast Asia
| [10] | Acheampong, E., T. F. Insaidoo, E. Marfo, and J. A. Adomako, Community participation and forest governance in West Africa. Forest Policy and Economics, 2020. 118: 102242.
https://doi.org/10.1016/j.forpol.2020.102242 |
| [12] | Rasolofoson, R. A., et al., Impacts of community forest management in Madagascar. Conservation Science and Practice, 2021. 3(5): e415. https://doi.org/10.1111/csp2.415 |
[10–12]
. Kenya’s forestry sector aligns with these global trends, as CFAs now play an increasingly central role in monitoring forest health, reporting fires, and supporting restoration initiatives.
Within Kenya, the Kenya Forest Service (KFS) has been at the forefront of institutionalizing digital technology in forestry. Over the last decade, KFS, in collaboration with universities, research institutions, and development partners, has established a suite of digital platforms including the Forest Information System (FIS), mobile GIS applications for field verification, drone reconnaissance workflows, and the Integrated Forest Alert System (IFAS). IFAS, in particular, represents a major technological shift: it integrates EO-based canopy disturbance alerts with app-based ground confirmation, spatial dashboards, and automated triaging protocols. Similar systems—such as Brazil’s DETER-RAM or Indonesia’s SIPONGI—have demonstrated the effectiveness of fused EO-and-ground verification workflows for enforcement
| [13] | INPE (National Institute for Space Research), DETER-RAM: Near-Real-Time Deforestation Alerts for the Brazilian Amazon. Government of Brazil, 2023. |
| [14] | Ministry of Environment and Forestry, Indonesia, SIPONGI: National Forest and Land Fire Monitoring System. Government of Indonesia, 2022. |
[13, 14]
. Kenya’s early experiences reflect this trajectory, with improvements in verification rates, shorter response times, and enhanced transparency when digital workflows are embedded into routine operations such as weekly data huddles, shift planning, and cross-agency escalation.
Global literature also points to the importance of institutional arrangements and human capacity in harnessing the full benefits of smart forestry. Technologies alone do not ensure outcomes; they must be integrated within coherent governance structures, training programs, and operational protocols
| [15] | Arts, B., J. Behagel, E. Turnhout, and J. de Koning, Forest governance: Ensuring effective policy integration. Current Opinion in Environmental Sustainability, 2021. 49: 107–115.
https://doi.org/10.1016/j.cosust.2021.02.001 |
| [17] | Wicaksono, P., and W. Lazuardi, Adoption of drone and GIS technologies for environmental monitoring in Southeast Asia. Environmental Monitoring and Assessment, 2020. 192: 604.
https://doi.org/10.1007/s10661-020-08600-9 |
[15–17]
. In Kenya, county governments, CFAs, and national agencies are still at varying stages of digital readiness. Issues such as digital literacy, device availability, mobile network coverage, and power access influence the performance of smart forestry systems. Studies in East Africa and the Congo Basin also show that rural ICT gaps, limited data infrastructure, and high connectivity costs frequently constrain the scalability of digital environmental monitoring solutions
| [18] | Kiyingi, I., et al., Digital barriers and ICT constraints in rural Sub-Saharan Africa: Implications for environmental monitoring. Information Technology for Development, 2022. 28(1): 145–164. https://doi.org/10.1080/02681102.2021.2005701 |
[18]
.
Nonetheless, Kenya’s ongoing pilots provide compelling evidence of the potential impact of digital forestry. In Kericho and Baringo counties, drone-assisted verification significantly improved coverage of rugged and inaccessible sites, reducing operational costs and clarifying ambiguous satellite alerts. Mobile GIS tools have strengthened documentation, geotagging, and evidence capture, allowing cleaner audit trails and more consistent decision-making. The integration of digital licensing into FIS has further improved transparency by enabling rapid cross-checking of authorized versus unauthorized activities. Similar innovations are emerging in forest value-chain governance, where QR-coded permits, digital marketplaces, and blockchain-style traceability tools are helping to reduce product laundering and strengthen compliance.
Given Kenya’s ambitious forest restoration targets—aligned with the AFR100 Initiative, the UN Decade on Ecosystem Restoration, and national MRV (Measurement, Reporting and Verification) commitments—digital innovation is no longer optional but essential for sustainable forest management
| [19] | AFR100 Secretariat, AFR100 Annual Progress Report on Forest Landscape Restoration in Africa. AUDA-NEPAD, Addis Ababa, 2023. |
| [20] | UNEP, Progress Review of the UN Decade on Ecosystem Restoration 2021–2030. Nairobi: United Nations Environment Programme, 2024. |
| [21] | World Bank, Digital Transformation for Green, Resilient and Inclusive Forests: A Policy and Investment Agenda for Kenya. Washington, D. C.: World Bank, 2022.
https://doi.org/10.1596/37216 |
[19-21]
. Smart forestry offers a viable pathway to enhance detection accuracy, accelerate enforcement, empower communities, and improve overall governance efficiency.
This paper synthesizes Kenya’s evolving smart-forestry landscape with a focus on operational insights from the IFAS roll-out in Kwale, Kilifi, Kericho, and Baringo counties (January 2023–March 2024). Specifically, it: (1) maps the digital toolchain—including EO alerts, drones, mobile GIS, dashboards, and licensing systems—used in forest management; (2) analyzes performance patterns from IFAS deployments, including volumes, timeliness, spatial concentration, and response outcomes; and (3) proposes a policy and investment agenda for scaling digital forestry, emphasizing ICT infrastructure, device provisioning, skills development, data governance, procurement, and interoperability requirements.
2. Methodology
2.1. Research Design and Scope
This study employed a mixed-methods design combining quantitative and qualitative approaches to understand how smart-forestry tools are being deployed in Kenya’s devolved forest governance system. Mixed-methods approaches are widely used in environmental and forest-monitoring research because they allow integration of operational datasets with user perceptions, thereby capturing both technological performance and institutional dynamics
| [22] | Creswell, J. W., & Plano Clark, V. L. Designing and Conducting Mixed Methods Research. 3rd ed. SAGE Publications, 2018. |
| [24] | Palinkas, L. A., Horwitz, S. M., Green, C. A., Wisdom, J. P., Duan, N., & Hoagwood, K. Purposeful sampling for qualitative data collection and analysis in mixed method implementation research. Administration and Policy in Mental Health and Mental Health Services Research, 2015, 42(5), 533–544.
https://doi.org/10.1007/s10488-013-0528-y |
[22–24]
.
The design centered on two complementary components:
(i). a structured survey of frontline forestry actors, and
(ii). secondary operational data generated through routine smart-forestry deployments in Kericho and Baringo counties.
The aim was not to introduce experimental treatments but to document real-world usage of digital tools—including Earth Observation (EO) alerts, mobile GIS applications, drones, and dashboard systems—and to summarize emerging operational patterns in verification rates, spatial clustering, response times, and coordination practices. The two counties were selected because both host active IFAS (Integrated Forest Alert System) pilots and represent contrasting ecological and operational environments.
2.2. Data Sources
(a) Primary data: Structured survey
A brief, self-administered questionnaire was distributed to officers directly involved in forest monitoring. Respondents included Kenya Forest Service (KFS) rangers, county forest officers, and Community Forest Association (CFA) focal persons stationed in Kericho and Baringo.
CFAs and frontline officers were purposively targeted because global and regional studies demonstrate that community monitoring, ranger-led verification, and hybrid digital–local reporting systems generate contextual insights that satellite-based systems alone cannot provide
| [25] | Johnson, N., Druckenmiller, M. L., Danielsen, F., & Pulsifer, P. L. The use of digital platforms for community-based monitoring. BioScience, 2021, 71(5): 452–466.
https://doi.org/10.1093/biosci/biaa162 |
| [27] | Miles, M. B., Huberman, A. M., & Saldaña, J. Qualitative Data Analysis: A Methods Sourcebook. 3rd ed., SAGE Publications, 2014 |
[25–27]
.
The questionnaire captured:
1) uptake of digital tools (mobile GIS, IFAS dashboards, drones),
2) perceived benefits (speed, transparency, coordination), and
3) operational or institutional constraints (connectivity, device access, digital literacy, costs).
Surveys were anonymous and submitted through digital forms to reduce reporting bias and ensure secure data capture.
(b) Secondary data: Operational records
Secondary data consisted of routine monitoring outputs and administrative summaries from KFS station logs in the two counties. These included:
1) counts of alerts received through IFAS,
2) verification attempts,
3) confirmation or dismissal outcomes,
4) incident types (illegal felling, charcoal production, encroachment), and
5) indicative response actions or referrals.
Station logs also provided qualitative notes on patrol planning, drone deployment, mobile-form compliance, and dashboard usage. Such operational datasets are central to understanding near-real-time forest monitoring performance globally and in Africa
| [7] | Hansen, M. C., A. Krylov, A. Kommareddy, A. Tyukavina, P. V. Potapov, and S. Turubanova, Humid tropical forest disturbance alerts using Landsat data. Environmental Research Letters, 2016. 11(3): 034008.
https://doi.org/10.1088/1748-9326/11/3/034008 |
| [9] | Alix-Garcia, J., E. McIntosh, K. Sims, and J. Welch, Community monitoring and forest outcomes under payments for ecosystem services. Proceedings of the National Academy of Sciences, 2021. 118(3): e2017322118.
https://doi.org/10.1073/pnas.2017322118 |
| [19] | AFR100 Secretariat, AFR100 Annual Progress Report on Forest Landscape Restoration in Africa. AUDA-NEPAD, Addis Ababa, 2023. |
| [21] | World Bank, Digital Transformation for Green, Resilient and Inclusive Forests: A Policy and Investment Agenda for Kenya. Washington, D. C.: World Bank, 2022.
https://doi.org/10.1596/37216 |
[7–9, 19–21]
.
2.3. Sampling Strategy and Inclusion Criteria
A purposive sampling technique was used, consistent with methodological guidance for operational forestry and environmental monitoring studies where only specific personnel possess relevant experiential knowledge
| [22] | Creswell, J. W., & Plano Clark, V. L. Designing and Conducting Mixed Methods Research. 3rd ed. SAGE Publications, 2018. |
| [24] | Palinkas, L. A., Horwitz, S. M., Green, C. A., Wisdom, J. P., Duan, N., & Hoagwood, K. Purposeful sampling for qualitative data collection and analysis in mixed method implementation research. Administration and Policy in Mental Health and Mental Health Services Research, 2015, 42(5), 533–544.
https://doi.org/10.1007/s10488-013-0528-y |
[22, 24]
.
Eligible respondents were active-duty KFS rangers, county forest officers, and CFA focal persons involved in verification or station-level coordination between January 2023 and March 2024.
For secondary data, all routine IFAS summaries and station logs recorded within the same timeframe were included. Records lacking essential metadata (timestamp, location, incident classification, county attribution) were excluded to maintain data integrity and comparability.
2.4. Measures and Variables
Three groups of measures were analyzed:
Digital tool usage indicators
1) binary uptake (yes/no) of mobile GIS, dashboards, drones.
2) usage frequency (daily, weekly, monthly, rarely).
Perceived enablers and constraints
connectivity, device availability, digital skills, coordination, costs
These factors are widely recognized as determinants of near-real-time (NRT) environmental monitoring performance
| [6] | Jha, C. S., S. Rodda, and K. C. Thumaty, Advances in satellite-based monitoring for forest governance. Remote Sensing Applications: Society and Environment, 2021. 24: 100611.
https://doi.org/10.1016/j.rsase.2021.100611 |
| [9] | Alix-Garcia, J., E. McIntosh, K. Sims, and J. Welch, Community monitoring and forest outcomes under payments for ecosystem services. Proceedings of the National Academy of Sciences, 2021. 118(3): e2017322118.
https://doi.org/10.1073/pnas.2017322118 |
| [15] | Arts, B., J. Behagel, E. Turnhout, and J. de Koning, Forest governance: Ensuring effective policy integration. Current Opinion in Environmental Sustainability, 2021. 49: 107–115.
https://doi.org/10.1016/j.cosust.2021.02.001 |
| [18] | Kiyingi, I., et al., Digital barriers and ICT constraints in rural Sub-Saharan Africa: Implications for environmental monitoring. Information Technology for Development, 2022. 28(1): 145–164. https://doi.org/10.1080/02681102.2021.2005701 |
[6–9, 15–18]
.
Operational performance indicators
1) alerts issued, verified, and closed
2) median time-to-verification
3) incident-type distributions
4) spatial patterns relative to roads, edges, or forest type
No causal inference was attempted; the focus was descriptive and exploratory.
2.5. Data Analysis Procedures
Survey responses were analyzed using descriptive statistics (proportions, medians, cross-tabulations). Open-ended responses were summarized thematically.
Secondary data were cleaned, categorized, and tabulated to profile device usage, alert handling, incident mixes, and verification timelines in each county.
Qualitative notes from station logs were used to contextualize quantitative patterns—e.g., linking slower verification times to connectivity gaps or difficult terrain. This triangulation aligns with established practices in mixed-methods environmental governance research
| [22] | Creswell, J. W., & Plano Clark, V. L. Designing and Conducting Mixed Methods Research. 3rd ed. SAGE Publications, 2018. |
| [23] | Creswell, J. W. Research Design: Qualitative, Quantitative, and Mixed Methods Approaches. 4th ed., SAGE Publications, 2014. |
| [27] | Miles, M. B., Huberman, A. M., & Saldaña, J. Qualitative Data Analysis: A Methods Sourcebook. 3rd ed., SAGE Publications, 2014 |
[22, 23, 27]
.
2.6. Ethical Considerations and Data Protection
All participants were informed of the study’s purpose and provided voluntary consent. No personally identifying information (PII) was collected. Operational datasets were anonymized and sensitive spatial information (e.g., illegal-activity coordinates, patrol routes) was generalized following international environmental data-security standards
| [20] | UNEP, Progress Review of the UN Decade on Ecosystem Restoration 2021–2030. Nairobi: United Nations Environment Programme, 2024. |
| [21] | World Bank, Digital Transformation for Green, Resilient and Inclusive Forests: A Policy and Investment Agenda for Kenya. Washington, D. C.: World Bank, 2022.
https://doi.org/10.1596/37216 |
[20, 21]
. Ethical principles of confidentiality and responsible data handling—especially regarding digital community submissions and ranger operations—were strictly observed in line with national forest governance frameworks.
3. Results and Discussion
3.1. Regulatory Architecture and Governance
3.1.1. Earth Observation and Near-Real-Time Alerts
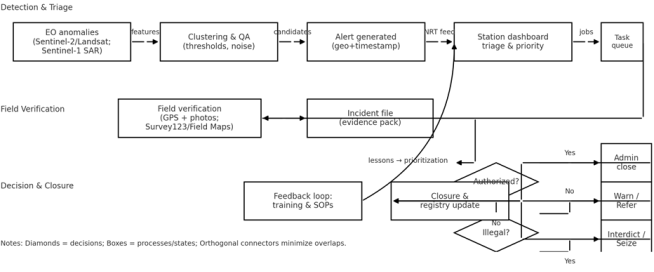
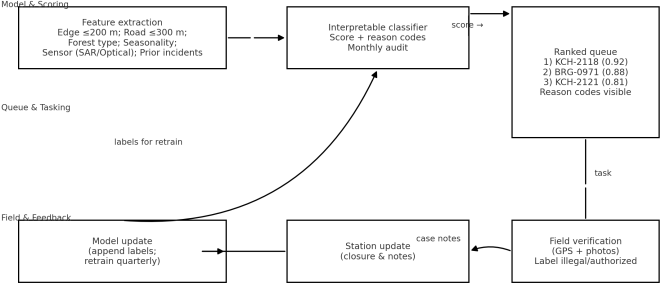
The alert-to-action pipeline (
Figure 1) demonstrates how Kenya’s Integrated Forest Alert System (IFAS) integrates multi-sensor Earth Observation (EO) data to deliver rapid disturbance detection and operational triage. Consistent with international evidence showing the value of near-real-time satellite alerting in tropical forest governance
| [5] | Republic of Kenya, Forest Conservation and Management Act, 2016. Nairobi: National Council for Law Reporting, 2016. |
| [7] | Hansen, M. C., A. Krylov, A. Kommareddy, A. Tyukavina, P. V. Potapov, and S. Turubanova, Humid tropical forest disturbance alerts using Landsat data. Environmental Research Letters, 2016. 11(3): 034008.
https://doi.org/10.1088/1748-9326/11/3/034008 |
| [8] | Tang, X., Y. Wang, X. Li, and J. Dong, Optical–SAR fusion for near-real-time forest disturbance monitoring: A systematic review. Remote Sensing, 2023. 15(4): 935.
https://doi.org/10.3390/rs15040935 |
[5, 7, 8]
, IFAS synthesizes optical (Sentinel-2, Landsat) and radar (Sentinel-1) inputs to minimize latency and ensure continuity during cloudy or rainy periods—a crucial advantage in Kenya’s diverse ecological zones.
In the system workflow, anomaly clusters generated through lightweight morphological filtering (
Figure 1, Node ②) help suppress speckle and consolidate adjacent pixels into incident candidates. This reduces false positives prior to human review, similar to approaches documented in regional and global monitoring systems
| [6] | Jha, C. S., S. Rodda, and K. C. Thumaty, Advances in satellite-based monitoring for forest governance. Remote Sensing Applications: Society and Environment, 2021. 24: 100611.
https://doi.org/10.1016/j.rsase.2021.100611 |
| [7] | Hansen, M. C., A. Krylov, A. Kommareddy, A. Tyukavina, P. V. Potapov, and S. Turubanova, Humid tropical forest disturbance alerts using Landsat data. Environmental Research Letters, 2016. 11(3): 034008.
https://doi.org/10.1088/1748-9326/11/3/034008 |
[6, 7]
. Once queued for action (Node ③), alerts synchronize to the National Forest Monitoring System (NFMS) dashboard and station-level viewers, allowing analysts to triage by reason codes (e.g., canopy loss, burn scars) and prioritize notifications.
Field verification (Node ④) adds
confirm,
dismiss, or
defer labels that strengthen model performance over time by improving threshold calibration—consistent with adaptive EO–ground feedback loops demonstrated in national monitoring systems such as Brazil’s DETER and Indonesia’s SIPONGI
| [13] | INPE (National Institute for Space Research), DETER-RAM: Near-Real-Time Deforestation Alerts for the Brazilian Amazon. Government of Brazil, 2023. |
| [14] | Ministry of Environment and Forestry, Indonesia, SIPONGI: National Forest and Land Fire Monitoring System. Government of Indonesia, 2022. |
[13, 14]
. The final action/closure stage (Node ⑤) documents operational outcomes (e.g., interdiction, advisory issuance, restoration flags), creating an auditable chain linking satellite detection to field response.
Overall, the IFAS pipeline reinforces findings that mixed-sensor inputs, structured filtering steps, and verification feedback loops substantially increase the accuracy and operational value of forest-disturbance alerts
| [7] | Hansen, M. C., A. Krylov, A. Kommareddy, A. Tyukavina, P. V. Potapov, and S. Turubanova, Humid tropical forest disturbance alerts using Landsat data. Environmental Research Letters, 2016. 11(3): 034008.
https://doi.org/10.1088/1748-9326/11/3/034008 |
| [9] | Alix-Garcia, J., E. McIntosh, K. Sims, and J. Welch, Community monitoring and forest outcomes under payments for ecosystem services. Proceedings of the National Academy of Sciences, 2021. 118(3): e2017322118.
https://doi.org/10.1073/pnas.2017322118 |
[7–9]
.
Figure 1. IFAS alert-to-action workflow (EO anomalies → cluster → mobile queue → verification → action/closure).
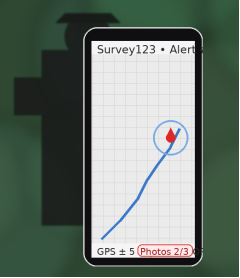
3.1.2. Mobile GIS and Structured Ground-Truthing
Figure 2. Mobile verification at an alert point; note enforced photo minimums and GPS accuracy readout.
Mobile GIS applications—primarily ArcGIS Field Maps and Survey123—significantly improved evidentiary standards during verification missions. As shown in
Figure 2, enforced photo minimums, mandatory GPS accuracy thresholds, and conditional logic within digital forms greatly reduced incomplete or inconsistent submissions. These results align with broader literature showing that structured digital data collection improves accuracy, auditability, and alignment between field teams and decision-makers
| [6] | Jha, C. S., S. Rodda, and K. C. Thumaty, Advances in satellite-based monitoring for forest governance. Remote Sensing Applications: Society and Environment, 2021. 24: 100611.
https://doi.org/10.1016/j.rsase.2021.100611 |
| [10] | Acheampong, E., T. F. Insaidoo, E. Marfo, and J. A. Adomako, Community participation and forest governance in West Africa. Forest Policy and Economics, 2020. 118: 102242.
https://doi.org/10.1016/j.forpol.2020.102242 |
| [11] | Young, D., A. Ferguson, and D. Gritten, Community-based forest monitoring: Lessons from global practice. Forest Ecology and Management, 2020. 472: 118223.
https://doi.org/10.1016/j.foreco.2020.118223 |
[6, 10, 11]
.
Stations that institutionalized app-based tasking and weekly review huddles recorded shorter median time-to-verify and higher closure rates, consistent with findings that strong operational routines amplify technological benefits
| [9] | Alix-Garcia, J., E. McIntosh, K. Sims, and J. Welch, Community monitoring and forest outcomes under payments for ecosystem services. Proceedings of the National Academy of Sciences, 2021. 118(3): e2017322118.
https://doi.org/10.1073/pnas.2017322118 |
| [12] | Rasolofoson, R. A., et al., Impacts of community forest management in Madagascar. Conservation Science and Practice, 2021. 3(5): e415. https://doi.org/10.1111/csp2.415 |
[9–12]
. The digital capture of geotagged images, coordinates, and standardized notes also strengthened evidence for enforcement and cross-agency review.
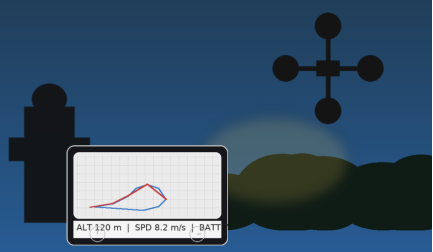
3.1.3. Low-Cost Drones for Reconnaissance and Planning
Low-cost multirotor drones played a significant role in resolving ambiguous alerts and extending ranger reach in rugged terrain. In both Kericho and Baringo counties, rapid UAV deployment enabled quick overflights of inaccessible areas (
Figure 3), reducing the need for resource-intensive foot patrols. International research consistently highlights the value of UAVs in environmental monitoring—improving situational awareness, reducing verification time, and increasing evidentiary clarity
| [16] | Bhattarai, T., and K. Giri, Digital transformation in forest management: Opportunities and constraints in developing countries. Journal of Forestry Research, 2021. 32: 225–238.
https://doi.org/10.1007/s11676-020-01177-y |
| [17] | Wicaksono, P., and W. Lazuardi, Adoption of drone and GIS technologies for environmental monitoring in Southeast Asia. Environmental Monitoring and Assessment, 2020. 192: 604.
https://doi.org/10.1007/s10661-020-08600-9 |
[16, 17]
.
Drone imagery helped differentiate true canopy loss from false positives caused by shadows, steep escarpments, or mixed-pixel artifacts. Orthomosaics were appended to case files and later used for restoration planning, firebreak alignment, and post-action audits. Station logs reported fewer aborted field walks and quicker confirm/dismiss decisions, demonstrating the operational efficiency gains enabled by UAV reconnaissance
| [16] | Bhattarai, T., and K. Giri, Digital transformation in forest management: Opportunities and constraints in developing countries. Journal of Forestry Research, 2021. 32: 225–238.
https://doi.org/10.1007/s11676-020-01177-y |
| [17] | Wicaksono, P., and W. Lazuardi, Adoption of drone and GIS technologies for environmental monitoring in Southeast Asia. Environmental Monitoring and Assessment, 2020. 192: 604.
https://doi.org/10.1007/s10661-020-08600-9 |
[16, 17]
.
Figure 3. UAV launch and controller display over an inaccessible alert cluster; imagery appended to case file for verification and planning.
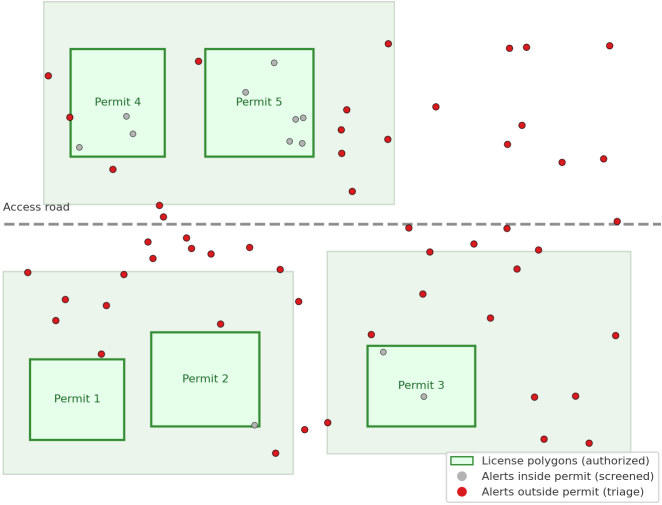
3.1.4. Digital Forest Information Systems and Licensing
As shown in
Figure 4, overlaying the Forest Information System (FIS) licensing layer on alert maps substantially reduced false positives associated with authorized operations. Because each license polygon is spatially linked to a specific block or compartment, analysts could quickly distinguish permitted from unauthorized activity and direct patrols toward high-risk anomalies. These benefits align with established research showing the role of digital forest registries in improving transparency and reducing enforcement friction
| [10] | Acheampong, E., T. F. Insaidoo, E. Marfo, and J. A. Adomako, Community participation and forest governance in West Africa. Forest Policy and Economics, 2020. 118: 102242.
https://doi.org/10.1016/j.forpol.2020.102242 |
| [15] | Arts, B., J. Behagel, E. Turnhout, and J. de Koning, Forest governance: Ensuring effective policy integration. Current Opinion in Environmental Sustainability, 2021. 49: 107–115.
https://doi.org/10.1016/j.cosust.2021.02.001 |
[10, 15]
.
The IFAS–FIS linkage also created an auditable workflow capturing license IDs, validity periods, approved volumes, and operator details. Rangers reported fewer on-scene disputes when carrying read-only license maps that mirrored those used at station dashboards, reinforcing local transparency and reducing conflict. Standard Operating Procedures documented the workflow:
(i) alert received → (ii) license overlay check → (iii) authorize/dismiss → (iv) escalate to patrol with embedded metadata.
Figure 4. License layer overlaid on alerts. “License polygons and recent alerts; authorized operations screened out at triage.”
3.1.5. Citizen/Community Sensing and Feedback Loops
As illustrated in
Figure 5, integrating geotagged submissions from Community Forest Association (CFA) members and forest scouts significantly strengthened situational awareness and improved alert interpretation. Community-based monitoring is widely recognized as a complementary mechanism to EO systems, offering contextual insights such as access routes, vehicle activity, local conflicts, and temporal patterns that cannot be inferred from satellite data alone
| [9] | Alix-Garcia, J., E. McIntosh, K. Sims, and J. Welch, Community monitoring and forest outcomes under payments for ecosystem services. Proceedings of the National Academy of Sciences, 2021. 118(3): e2017322118.
https://doi.org/10.1073/pnas.2017322118 |
| [12] | Rasolofoson, R. A., et al., Impacts of community forest management in Madagascar. Conservation Science and Practice, 2021. 3(5): e415. https://doi.org/10.1111/csp2.415 |
[9–12]
.
CFA submissions—comprising geotagged photos, notes, and GPS points—generated higher-quality leads and more targeted deployments when accompanied by metadata requirements. Non-punitive feedback loops (acknowledgement, outcome summaries, safety checks) increased repeat reporting and reduced rumor-based or unverified submissions. Redacted public outputs preserved anonymity, in line with best practices for ethical community-based environmental monitoring
| [18] | Kiyingi, I., et al., Digital barriers and ICT constraints in rural Sub-Saharan Africa: Implications for environmental monitoring. Information Technology for Development, 2022. 28(1): 145–164. https://doi.org/10.1080/02681102.2021.2005701 |
[18]
.
Overall, community sensing complemented EO detection and mobile verification by narrowing search areas, improving interdiction timing, and enhancing the narrative completeness of verification reports.
Figure 5. CFA focal person submitting a report. Community sensing complements EO detection; identifiable details removed in public outputs.
3.2. Evidence from Kenya’s Integrated Forest Alert System (IFAS)
3.2.1. Pipeline Performance: Volumes, Mix, and Timeliness
As summarized in
Table 1, the IFAS pipeline generated 2,750 alerts across Kericho (1,800) and Baringo (950) between January 2023 and March 2024. Illegal felling dominated the portfolio at about 69% of alerts (1,906 cases), followed by charcoal-related activity (~19%) and encroachment (~11%). These incident mixes mirror global patterns in which timber and woodfuel value chains remain the primary drivers of local forest disturbance, with encroachment emerging where agricultural and grazing frontiers push against forest margins
| [2] | FAO, State of the World’s Forests 2022: Forest pathways for green recovery and building inclusive, resilient and sustainable economies. Rome: Food and Agriculture Organization of the United Nations, 2022. https://doi.org/10.4060/cb9360en |
| [3] | Seppälä, R., J. Blanco, and B. Mannazzu, Forest disturbances under climate change. Nature Reviews Earth & Environment, 2022. 3(2): 104–118.
https://doi.org/10.1038/s43017-021-00244-7 |
| [28] | Weisse, M. J., & Pickens, A. H. Mapping the world’s free-flowing rivers and forest disturbance: Near-real-time monitoring for enforcement and policy. World Resources Institute Technical Report, 2021. |
[2, 3, 28]
.
Kericho exhibited a shorter median time to first verification (5.5 h) than Baringo (8.3 h), producing a weighted overall median of approximately 6.5 h (
Table 1). Verification performance was high: 84.8% of all alerts were checked on the ground, around 60% recorded an immediate on-site response, and 77.9% were ultimately closed or resolved. These figures are broadly consistent with near-real-time (NRT) systems elsewhere, where rapid checks and a high verification ratio underpin deterrence and accountability
| [7] | Hansen, M. C., A. Krylov, A. Kommareddy, A. Tyukavina, P. V. Potapov, and S. Turubanova, Humid tropical forest disturbance alerts using Landsat data. Environmental Research Letters, 2016. 11(3): 034008.
https://doi.org/10.1088/1748-9326/11/3/034008 |
| [13] | INPE (National Institute for Space Research), DETER-RAM: Near-Real-Time Deforestation Alerts for the Brazilian Amazon. Government of Brazil, 2023. |
| [28] | Weisse, M. J., & Pickens, A. H. Mapping the world’s free-flowing rivers and forest disturbance: Near-real-time monitoring for enforcement and policy. World Resources Institute Technical Report, 2021. |
[7, 13, 28]
.
Table 1 also highlights how institutional capacity shapes outcomes. Kericho’s faster verification and higher closure rates align with its stronger station staffing, more consistent use of app-based tasking, and more regular coordination meetings. In contrast, Baringo’s slower tempo appears linked to more challenging terrain, weaker connectivity, and a larger share of remote alerts that require longer travel times, reflecting similar constraints documented in other African NRT monitoring pilots
| [18] | Kiyingi, I., et al., Digital barriers and ICT constraints in rural Sub-Saharan Africa: Implications for environmental monitoring. Information Technology for Development, 2022. 28(1): 145–164. https://doi.org/10.1080/02681102.2021.2005701 |
| [21] | World Bank, Digital Transformation for Green, Resilient and Inclusive Forests: A Policy and Investment Agenda for Kenya. Washington, D. C.: World Bank, 2022.
https://doi.org/10.1596/37216 |
| [28] | Weisse, M. J., & Pickens, A. H. Mapping the world’s free-flowing rivers and forest disturbance: Near-real-time monitoring for enforcement and policy. World Resources Institute Technical Report, 2021. |
[18, 21, 28]
.
Table 1. IFAS alert pipeline metrics (Jan 2023–Mar 2024) (excerpted for Kericho and Baringo with overall for context).
Metric | Kericho | Baringo | Overall |
Total alerts issued | 1,800 | 950 | 2,750 |
Illegal felling (%) | 70% (1,260) | 68% (646) | 69.3% (1,906) |
Charcoal (%) | 18% (324) | 22% (209) | 19.4% (533) |
Encroachment (%) | 12% (216) | 10% (95) | 11.3% (311) |
Median time to first verification (h) | 5.5 | 8.3 | 6.5 |
Alerts verified (% of issued) | 90.0% | 75.0% | 84.8% |
Response recorded at verification (%) | 65.0% | 50.0% | 59.8% |
Alerts resolved/closed (%) | 82.0% | 70.0% | 77.9% |
As shown in
Table 1, Kericho’s faster verification and higher closure correlate with stronger station capacity and coordination; Baringo’s slower tempo appears linked to access and coverage constraints.
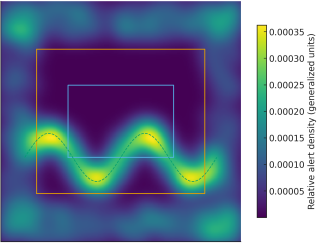
Figure 6. Kernel-density surface of alerts (Jan 2023–Mar 2024). Persistent hotspots cluster within 200 m of edges and along access routes; indigenous forest cores show fewer verified events. (Use a generalized heatmap; mask sensitive coordinates).
As visualized in
Figure 6, alerts form persistent hotspots within roughly 200 m of forest edges and along roads and tracks, producing a series of linear, corridor-like bands. In contrast, indigenous forest cores display sparse, discontinuous clusters with fewer verified incidents. This spatial skew likely reflects both opportunity and observability: illegal felling and charcoal production concentrate near access points and egress routes, while NRT verification and patrol access are also easiest near edges and along roads
| [3] | Seppälä, R., J. Blanco, and B. Mannazzu, Forest disturbances under climate change. Nature Reviews Earth & Environment, 2022. 3(2): 104–118.
https://doi.org/10.1038/s43017-021-00244-7 |
| [29] | Laurance, W. F., Goosem, M., & Laurance, S. G. W. Impacts of roads and linear clearings on tropical forests. Trends in Ecology & Evolution, 2009, 24(12): 659–669.
https://doi.org/10.1016/j.tree.2009.06.009 |
| [30] | Broadbent, E. N., Asner, G. P., Keller, M., Knapp, D. E., Oliveira, P. J. C., & Silva, J. N. Forest fragmentation and edge effects from deforestation and selective logging in the Brazilian Amazon. Biological Conservation, 2008, 141(7): 1745–1757. https://doi.org/10.1016/j.biocon.2008.04.024 |
[3, 29, 30]
. The pattern in
Figure 6 therefore supports an operational strategy that prioritizes edge-proximate patrols, choke-point checks on feeder roads, and UAV sweeps along high-intensity corridors, while core areas may require radar-assisted screening and longer-range reconnaissance to avoid under-detecting interior incursions
| [8] | Tang, X., Y. Wang, X. Li, and J. Dong, Optical–SAR fusion for near-real-time forest disturbance monitoring: A systematic review. Remote Sensing, 2023. 15(4): 935.
https://doi.org/10.3390/rs15040935 |
| [17] | Wicaksono, P., and W. Lazuardi, Adoption of drone and GIS technologies for environmental monitoring in Southeast Asia. Environmental Monitoring and Assessment, 2020. 192: 604.
https://doi.org/10.1007/s10661-020-08600-9 |
| [31] | Reiche, J., Hamunyela, E., Verbesselt, J., Hoekman, D., & Herold, M. Improving near-real-time deforestation monitoring in tropical moist forests by combining SAR and optical data. Remote Sensing of Environment, 2018, 204: 147–161.
https://doi.org/10.1016/j.rse.2017.10.034 |
[8, 17, 31]
.
3.2.2. Spatial Ecology of Alerts
Consistent with the kernel-density surface in
Figure 6, edge-proximate locations (≤200 m from the forest boundary) concentrate the highest alert densities in both counties, with Kericho showing “very high” edge densities and Baringo “high” (
Table 2). Proximity to roads and settlements reinforces this pattern, creating linear hotspot corridors that track likely extraction and transport routes. Slope moderates activity: alerts decline on steeper terrain, with a modest dampening in Kericho and a stronger effect on Baringo’s escarpments, indicating terrain-constrained access and higher operational costs for patrols
| [3] | Seppälä, R., J. Blanco, and B. Mannazzu, Forest disturbances under climate change. Nature Reviews Earth & Environment, 2022. 3(2): 104–118.
https://doi.org/10.1038/s43017-021-00244-7 |
| [29] | Laurance, W. F., Goosem, M., & Laurance, S. G. W. Impacts of roads and linear clearings on tropical forests. Trends in Ecology & Evolution, 2009, 24(12): 659–669.
https://doi.org/10.1016/j.tree.2009.06.009 |
| [30] | Broadbent, E. N., Asner, G. P., Keller, M., Knapp, D. E., Oliveira, P. J. C., & Silva, J. N. Forest fragmentation and edge effects from deforestation and selective logging in the Brazilian Amazon. Biological Conservation, 2008, 141(7): 1745–1757. https://doi.org/10.1016/j.biocon.2008.04.024 |
[3, 29, 30]
.
By forest type, indigenous/natural forests dominate verified incidents in Kericho (~71%), whereas Baringo presents a mixed signal between indigenous forests and dry woodlands, reflecting charcoal-oriented pressure and grazing demands. Interface issues also differ. In Kericho, plantation edges and smallholder boundaries are frequent sites of encroachment and small-scale timber theft. In Baringo, charcoal production and grazing pressures are more prominent in dry woodlands (
Table 2). Taken together, these spatial gradients suggest that alerts are co-produced by biophysical accessibility (edges, roads, gentle slopes) and human incentives (timber and woodfuel values, land scarcity), reinforcing evidence from other fragmented forest landscapes
| [28] | Weisse, M. J., & Pickens, A. H. Mapping the world’s free-flowing rivers and forest disturbance: Near-real-time monitoring for enforcement and policy. World Resources Institute Technical Report, 2021. |
| [30] | Broadbent, E. N., Asner, G. P., Keller, M., Knapp, D. E., Oliveira, P. J. C., & Silva, J. N. Forest fragmentation and edge effects from deforestation and selective logging in the Brazilian Amazon. Biological Conservation, 2008, 141(7): 1745–1757. https://doi.org/10.1016/j.biocon.2008.04.024 |
[28–30]
. This supports terrain-aware routing, edge-focused patrols, and targeted surveillance at access points as high-leverage operational choices.
Table 2. Spatial risk gradients and forest-type signal (qualitative summary).
Indicator | Kericho | Baringo |
Edge proximity (≤200 m) | Very high alert density | High alert density |
Road/settlement proximity | High | High |
Slope effect | Moderate dampening | Stronger dampening in escarpments |
Dominant forest type in verified incidents | Indigenous/natural (≈71%) | Indigenous/dry-woodland mix |
Typical interface issues | Plantation edges; smallholder boundaries | Charcoal in dry woodlands; grazing pressures |
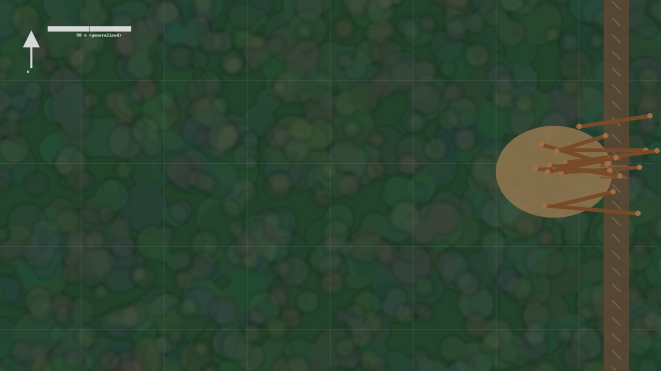
As illustrated in
Figure 7, under-canopy orthomosaics further clarify the relationship between forest structure, access, and incident risk. The example shows an edge-proximate cluster with clear vehicular access: wheel ruts and skid trails link the felling patch to a feeder road, visually explaining the corridor-like hotspot pattern observed in
Figure 6. Orthomosaics delineate fresh canopy gaps, stump locations, and log stacks under partial cover—features that are difficult to confirm from satellite imagery alone but critical for evidentiary mapping and case-building
| [16] | Bhattarai, T., and K. Giri, Digital transformation in forest management: Opportunities and constraints in developing countries. Journal of Forestry Research, 2021. 32: 225–238.
https://doi.org/10.1007/s11676-020-01177-y |
| [17] | Wicaksono, P., and W. Lazuardi, Adoption of drone and GIS technologies for environmental monitoring in Southeast Asia. Environmental Monitoring and Assessment, 2020. 192: 604.
https://doi.org/10.1007/s10661-020-08600-9 |
| [26] | Danielsen, F., Eicken, H., Funder, M., Johnson, N., Lee, O., Theilade, I., Argyriou, D., & Burgess, N. D. Community monitoring of natural resource systems and the environment. Annual Review of Environment and Resources, 2022, 47: 637–670. https://doi.org/10.1146/annurev-environ-012220-022325 |
[16, 17, 26]
. When appended to digital case files, these tiles provide a verifiable chain from initial alert through on-scene mapping to geotagged features that support precise stump counts, harvest-direction inferences, and reconstruction of egress routes. Operationally,
Figure 7 illustrates how low-altitude mapping supports faster confirm/dismiss decisions, better planning of follow-up patrols (e.g., choke-points on the access spur), and more informed restoration design along disturbed edges.
Figure 7. Under-canopy orthomosaic of an illegal felling site. Edge-proximate cluster with vehicular access visible; images appended to the case file.
3.2.3. Working of the System
The survey and station logs indicate that the most successful stations combine digital tools with robust coordination routines. Stations in Kericho that held weekly ranger–County Forest Officer Conservator (CFC) meetings and used app-based tasking converted a larger share of alerts to verified cases and closed them more quickly than stations with ad hoc coordination. Cross-agency ties—particularly between KFS, the police, and local administrative chiefs—also improved enforcement “hit rates” and follow-through on confirmed cases, echoing broader findings on the importance of institutional collaboration in environmental enforcement
| [15] | Arts, B., J. Behagel, E. Turnhout, and J. de Koning, Forest governance: Ensuring effective policy integration. Current Opinion in Environmental Sustainability, 2021. 49: 107–115.
https://doi.org/10.1016/j.cosust.2021.02.001 |
| [21] | World Bank, Digital Transformation for Green, Resilient and Inclusive Forests: A Policy and Investment Agenda for Kenya. Washington, D. C.: World Bank, 2022.
https://doi.org/10.1596/37216 |
| [28] | Weisse, M. J., & Pickens, A. H. Mapping the world’s free-flowing rivers and forest disturbance: Near-real-time monitoring for enforcement and policy. World Resources Institute Technical Report, 2021. |
[15, 21, 28]
.
Photo-rich submissions (≥93% of verified cases meeting the minimum photo requirement) correlated with higher confirmation certainty and fewer subsequent follow-up visits, suggesting that evidence quality and operational efficiency are mutually reinforcing. Conversely, patchy mobile coverage, device scarcity, and limited digital literacy slowed verification and increased the proportion of aged, unverified alerts. These frictions are consistent with ICT access and skills gaps reported in other rural monitoring initiatives in Sub-Saharan Africa
| [18] | Kiyingi, I., et al., Digital barriers and ICT constraints in rural Sub-Saharan Africa: Implications for environmental monitoring. Information Technology for Development, 2022. 28(1): 145–164. https://doi.org/10.1080/02681102.2021.2005701 |
| [25] | Johnson, N., Druckenmiller, M. L., Danielsen, F., & Pulsifer, P. L. The use of digital platforms for community-based monitoring. BioScience, 2021, 71(5): 452–466.
https://doi.org/10.1093/biosci/biaa162 |
| [26] | Danielsen, F., Eicken, H., Funder, M., Johnson, N., Lee, O., Theilade, I., Argyriou, D., & Burgess, N. D. Community monitoring of natural resource systems and the environment. Annual Review of Environment and Resources, 2022, 47: 637–670. https://doi.org/10.1146/annurev-environ-012220-022325 |
[18, 25, 26]
.
Table 3. Coordination frequency and effectiveness (Kericho vs. Baringo) (from user survey & station logs).
Measure | Kericho | Baringo |
Weekly ranger–county meetings (frequency) | 80% | 75% |
Monthly HQ–county calls (frequency) | 80% | 60% |
Quarterly multi-stakeholder reviews (frequency) | 70% | 50% |
Real-time sharing via mobile/apps (frequency) | 78% | 70% |
National–County coordination (good/excellent) | 74% | 66% |
County–Community coordination (good/excellent) | 78% | 60% |
KFS–NGO coordination (good/excellent) | 70% | 65% |
Inter-agency (KFS–Police–Chiefs) (good/excellent) | 74% | 58% |
Overall,
Table 3 shows that Kericho’s stronger cadence of coordination and higher perceived effectiveness aligns with its faster verification and closure rates, underscoring that IFAS performance depends as much on “people and processes” as on the underlying technology stack.
3.2.4. User-Reported Frictions and Opportunities
Frontline users identified five main frictions: limited digital literacy (≈64%), poor mobile-network coverage (≈74%), inadequate smartphones (≈57%), airtime/data costs (≈47%), and occasional app glitches or downtime (≈33%). At the same time, they credited IFAS with several important gains: improved real-time detection and response (≈80%), stronger transparency and accountability (≈71%), enhanced community reporting (≈69%), more data-guided patrol planning (≈64%), and better cross-agency coordination (≈58%). These patterns mirror evaluations of other digital environmental monitoring platforms that find concurrent technology, capacity, and institutional constraints alongside clear benefits in speed, coverage, and documentation
| [15] | Arts, B., J. Behagel, E. Turnhout, and J. de Koning, Forest governance: Ensuring effective policy integration. Current Opinion in Environmental Sustainability, 2021. 49: 107–115.
https://doi.org/10.1016/j.cosust.2021.02.001 |
| [18] | Kiyingi, I., et al., Digital barriers and ICT constraints in rural Sub-Saharan Africa: Implications for environmental monitoring. Information Technology for Development, 2022. 28(1): 145–164. https://doi.org/10.1080/02681102.2021.2005701 |
| [21] | World Bank, Digital Transformation for Green, Resilient and Inclusive Forests: A Policy and Investment Agenda for Kenya. Washington, D. C.: World Bank, 2022.
https://doi.org/10.1596/37216 |
| [25] | Johnson, N., Druckenmiller, M. L., Danielsen, F., & Pulsifer, P. L. The use of digital platforms for community-based monitoring. BioScience, 2021, 71(5): 452–466.
https://doi.org/10.1093/biosci/biaa162 |
[15, 18, 21, 25]
.
Table 4. User-reported constraints and opportunities (Kericho & Baringo) (survey n≈120; county slices).
Category | Kericho | Baringo |
Limited digital literacy | 52% | 70% |
Poor mobile coverage | 66% | 82% |
Inadequate smartphones | 47% | 60% |
Airtime/data costs | 39% | 54% |
App glitches/downtime | 37% | 35% |
Real-time detection/response (opportunity) | 84% | 78% |
Transparency/accountability ↑ (opportunity) | 74% | 71% |
Community reporting ↑ (opportunity) | 67% | 66% |
Data-driven patrol/planning (opportunity) | 70% | 62% |
Cross-agency coordination ↑ (opportunity) | 60% | 59% |
As
Table 4 indicates, Baringo faces steeper connectivity and device hurdles than Kericho. Nonetheless, users in both counties perceive substantial gains in responsiveness, accountability, and community engagement from the digital stack. This suggests that targeted investments in people (training and mentoring), tools (devices, power solutions, data bundles), and routines (regular huddles, after-action reviews) are likely to yield more impact than wholesale redesign of the system architecture.
3.3. Technology Deep-Dives and Kenyan Use Cases
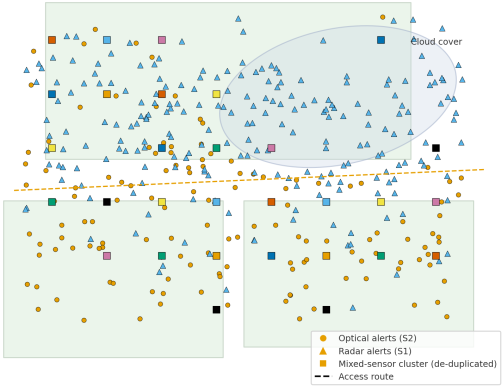
3.3.1. Optical–Radar Fusion for All-Weather Detection
Coastal cloud cover and highland rains periodically degrade optical imagery; during such periods, relying solely on Sentinel-2 or Landsat would leave large temporal gaps in disturbance detection. Integrating Sentinel-1 Synthetic Aperture Radar (SAR) with optical sensors stabilizes detection during wet seasons and immediately after storms by providing cloud-penetrating measurements of canopy structure
| [8] | Tang, X., Y. Wang, X. Li, and J. Dong, Optical–SAR fusion for near-real-time forest disturbance monitoring: A systematic review. Remote Sensing, 2023. 15(4): 935.
https://doi.org/10.3390/rs15040935 |
[8]
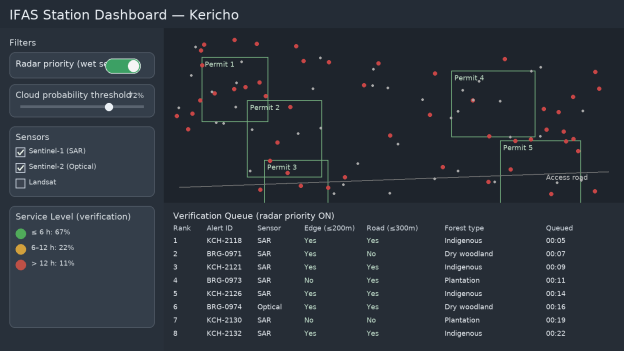
. Kenyan stations have begun piloting “radar-first” rules during rainy months—for example, auto-prioritizing radar-only alerts when cloud probability exceeds 70% and reviewing mixed queues on dashboards before tasking field teams.
Under these rules, blended anomaly clustering helps reduce “salt-and-pepper” noise and keeps verification queues manageable in Kericho’s rainy periods and along Baringo’s escarpments. This approach aligns with international experience showing that optical–radar fusion can significantly improve NRT monitoring continuity and precision in humid or cloud-prone environments
| [31] | Reiche, J., Hamunyela, E., Verbesselt, J., Hoekman, D., & Herold, M. Improving near-real-time deforestation monitoring in tropical moist forests by combining SAR and optical data. Remote Sensing of Environment, 2018, 204: 147–161.
https://doi.org/10.1016/j.rse.2017.10.034 |
[31]
.
Figure 8. Optical vs. radar alert overlay for a wet-season week in Kericho. Radar (Sentinel-1) surfaces alerts missed by cloud-obscured optical (Sentinel-2); mixed-sensor clustering reduces duplicates before mobile tasking. (Mask/perturb coordinates to protect sensitive patrol areas).
Figure 9. Station dashboard with “radar-priority” toggle enabled. Wet-season SOPs in Kericho route radar-only anomalies to top of the verification list, shortening time-to-first-check.
3.3.2. Drones as a Multi-Purpose Force Multiplier
Beyond resolving ambiguous alerts, drones have proven to be a multi-purpose force multiplier for station operations. Flight logs and case files from Kericho and Baringo show that UAVs were used to: (i) map fire perimeters and identify hotspots; (ii) assess storm damage and windthrow patches; (iii) quantify pit-sawing footprints under canopy gaps; and (iv) support restoration design, including placement of contour-aligned planting strips and access paths. These uses are consistent with emerging global practice in which drones complement satellites by providing high-resolution, task-specific views over small, complex areas
| [16] | Bhattarai, T., and K. Giri, Digital transformation in forest management: Opportunities and constraints in developing countries. Journal of Forestry Research, 2021. 32: 225–238.
https://doi.org/10.1007/s11676-020-01177-y |
| [17] | Wicaksono, P., and W. Lazuardi, Adoption of drone and GIS technologies for environmental monitoring in Southeast Asia. Environmental Monitoring and Assessment, 2020. 192: 604.
https://doi.org/10.1007/s10661-020-08600-9 |
| [26] | Danielsen, F., Eicken, H., Funder, M., Johnson, N., Lee, O., Theilade, I., Argyriou, D., & Burgess, N. D. Community monitoring of natural resource systems and the environment. Annual Review of Environment and Resources, 2022, 47: 637–670. https://doi.org/10.1146/annurev-environ-012220-022325 |
[16, 17, 26]
.
Figure 10. On-scene drone launch at an edge-proximate alert cluster (Baringo). Orthomosaics appended to the case file for prosecution and post-action audit.
3.3.3. AI-Assisted Triage
Simple, interpretable classifiers trained on Kenyan verification labels can help pre-rank alerts by their likelihood of representing illegal activity versus authorized or benign silviculture. Candidate features include edge proximity, distance to roads and settlements, forest type, season, rainfall conditions, and sensor source (radar versus optical). Internationally, similar models have been used to prioritize limited enforcement resources while keeping human reviewers “in the loop”
| [28] | Weisse, M. J., & Pickens, A. H. Mapping the world’s free-flowing rivers and forest disturbance: Near-real-time monitoring for enforcement and policy. World Resources Institute Technical Report, 2021. |
| [31] | Reiche, J., Hamunyela, E., Verbesselt, J., Hoekman, D., & Herold, M. Improving near-real-time deforestation monitoring in tropical moist forests by combining SAR and optical data. Remote Sensing of Environment, 2018, 204: 147–161.
https://doi.org/10.1016/j.rse.2017.10.034 |
| [32] | Ferraro, P. J., & Hanauer, M. M. Advances in measuring the environmental and social impacts of environmental programs. Annual Review of Environment and Resources, 2014, 39: 495–517. https://doi.org/10.1146/annurev-environ-101813-013230 |
[28, 31, 32]
.
In the IFAS context, such models should be audited regularly (e.g., quarterly) and exposed in dashboards as transparent “reason codes” (e.g., “edge ≤200 m; road ≤300 m; indigenous forest; repeat hotspot”) rather than opaque scores, aligning with Kenyan preferences for explainable, evidence-based decision support. Field verification labels can then feed back into model retraining, gradually improving triage accuracy while preserving ranger discretion and accountability.
Figure 11. Human-in-the-loop triage. Alerts enter with feature scores; station lead sees ranked queue plus reason codes; field verification feeds back labels for continuous improvement.
Table 5. Triage model feature catalog and governance plan.
Feature | Rationale | Data source | Governance/Audit |
Edge (≤200 m) | Highest incident density near edges | IFAS spatial derivations | Drift check monthly |
Distance to road/settlement | Access proxy, correlates with speed & likelihood | National basemaps | Update basemaps quarterly |
Forest type | Indigenous hot spots; plantations often benign | KFS inventory | Review mislabels in SOP huddles |
Season & rainfall | Cloud/rain biases optical; activity seasonality | IMD/CHIRPS | Calibrate radar-priority rules |
Sensor flag (S1/S2) | Modality affects alert reliability | Alert metadata | Audit wet-season precision |
Prior incident memory | Deterrence or repeat hotspots | IFAS history | 90-day decay; privacy by design |
3.3.4. Timber Traceability and Marketplace Integrity
Digitized licensing, linked to spatial compartments and complemented by QR or GS1 tags on timber loads, allows roadside teams to validate permits in real time and reconstruct the chain-of-custody from stand to checkpoint. For smallholders and CFAs, such systems can unlock premium markets for verified legal timber, bamboo, and non-timber forest products (NTFPs) such as honey. For regulators, they constrain laundering by increasing the likelihood that mis-declared loads will be detected
| [21] | World Bank, Digital Transformation for Green, Resilient and Inclusive Forests: A Policy and Investment Agenda for Kenya. Washington, D. C.: World Bank, 2022.
https://doi.org/10.1596/37216 |
| [28] | Weisse, M. J., & Pickens, A. H. Mapping the world’s free-flowing rivers and forest disturbance: Near-real-time monitoring for enforcement and policy. World Resources Institute Technical Report, 2021. |
[21, 28]
.
Linking license layers directly into IFAS triage further reduces false positives: alerts that fall entirely within valid license polygons can be screened out quickly, allowing ranger effort to focus on genuinely anomalous signals. This “registry-aware” triage reflects broader moves toward integrated digital registries that combine permitting, spatial data, and monitoring information in a single operational view
| [15] | Arts, B., J. Behagel, E. Turnhout, and J. de Koning, Forest governance: Ensuring effective policy integration. Current Opinion in Environmental Sustainability, 2021. 49: 107–115.
https://doi.org/10.1016/j.cosust.2021.02.001 |
| [21] | World Bank, Digital Transformation for Green, Resilient and Inclusive Forests: A Policy and Investment Agenda for Kenya. Washington, D. C.: World Bank, 2022.
https://doi.org/10.1596/37216 |
| [33] | Hoare, A. Tackling Illegal Logging and the Related Trade: What Progress and Where Next? Chatham House Report, The Royal Institute of International Affairs, London, 2015 |
[15, 21, 33]
.
Figure 12. Roadside QR scan of a licensed timber load. FIS returns permit status and compartment geometry; anomalies flagged for inspection.
3.4. Monitoring, Evaluation and Learning (MEL)
3.4.1. Operational KPIs
To sustain performance and learning, IFAS data need to be translated into a small, stable set of operational key performance indicators (KPIs). At minimum, stations should track the full funnel—alerts issued → verified → confirmed illegal → actioned → closed—together with medians and distributions for time-to-verification and time-to-closure, disaggregated by station and forest type. Publishing anonymized quarterly dashboards can strengthen accountability, enable peer comparison, and provide a basis for targeted support rather than generic sanctions
| [21] | World Bank, Digital Transformation for Green, Resilient and Inclusive Forests: A Policy and Investment Agenda for Kenya. Washington, D. C.: World Bank, 2022.
https://doi.org/10.1596/37216 |
| [28] | Weisse, M. J., & Pickens, A. H. Mapping the world’s free-flowing rivers and forest disturbance: Near-real-time monitoring for enforcement and policy. World Resources Institute Technical Report, 2021. |
[21, 28]
.
Table 6. KPI dictionary and computation rules (aligned to IFAS definitions).
KPI | Definition | Numerator / Denominator | Disaggregation |
Verification rate | Alerts with on-site verification | Verified / Issued | Station, forest type |
Median time-to-verification | Hours: alert→first field check | Median over verified | Station |
Action at verification | Recorded response on first visit | Response / Verified | Action type |
Closure rate | Alerts with status “closed” | Closed / Issued | Reason (neutralized, referred) |
Photo completeness | Forms meeting photo threshold | Forms ≥3 photos / Verified | Device cohort |
Accuracy compliance | GPS fix ≤10 m | Compliant / Verified | County, terrain |
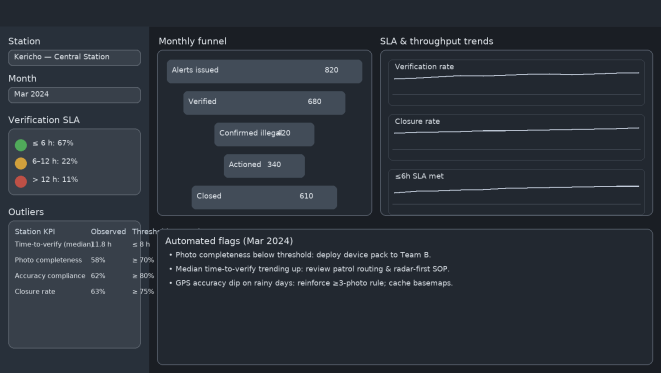
As illustrated in
Figure 13, the monthly funnel visual follows cases from alerts issued through queueing, verification, response logging, and closure, with service-level-agreement (SLA) timers wrapped around each stage to highlight delay points. Outlier cards on the dashboard surface stations or shifts that regularly breach SLAs—for example, unusually long time-to-verify or low “verify→close” conversion—triggering targeted coaching or device/connectivity fixes rather than blanket reprimands. Leading indicators (open backlog by age band, median verification time, percentage with on-scene response) are paired with lagging outcomes (closure rates, days-to-close), allowing weekly station huddles to move from anecdotes toward root-cause analysis. Drill-down views allow supervisors to pivot by alert type, edge distance, patrol team, or handset cohort, so that a spike in edge-proximate illegal felling can be met with route adjustments, while handset sync failures prompt handset swaps or offline-first workflows.
Overall,
Figure 13 illustrates how a simple, SLA-aware KPI funnel can convert raw IFAS data into operational discipline: shorter verification cycles, more complete evidence packets, and steadier closure performance over time.
Figure 13. Station KPI dashboard mock-up (Kericho focus). Monthly funnel with SLA timers; outliers trigger coaching or device/connectivity fixes.
3.4.2. Outcome Evaluation
Beyond operational KPIs, outcome evaluation is needed to understand whether IFAS is reducing illegal activities and improving restoration outcomes. Where feasible, stations can use matched controls or difference-in-differences (DID) designs comparing patrol beats before and after IFAS adoption, with similar beats that have not yet fully implemented the system serving as comparators. Staggered rollout across stations may support stepped-wedge designs, while county-level analyses can draw on interrupted time-series methods
| [21] | World Bank, Digital Transformation for Green, Resilient and Inclusive Forests: A Policy and Investment Agenda for Kenya. Washington, D. C.: World Bank, 2022.
https://doi.org/10.1596/37216 |
| [28] | Weisse, M. J., & Pickens, A. H. Mapping the world’s free-flowing rivers and forest disturbance: Near-real-time monitoring for enforcement and policy. World Resources Institute Technical Report, 2021. |
| [32] | Ferraro, P. J., & Hanauer, M. M. Advances in measuring the environmental and social impacts of environmental programs. Annual Review of Environment and Resources, 2014, 39: 495–517. https://doi.org/10.1146/annurev-environ-101813-013230 |
[21, 28, 32]
.
Outcome metrics might include changes in illegal events per month, time-to-closure, prosecutions (charges filed, convictions), restoration follow-through (seedling survival at closed cases), and deterrence indicators (declining repeat alerts within 500 m and 90 days of a prior incident). Kenya’s decentralized coordination patterns—weekly huddles, cross-agency tasking, CFA reporting practices—are already captured in the survey and station-log data and can be used as covariates to explain station-level variation in outcomes.
Table 7. Outcome-evaluation design matrix.
Outcome | Unit | Identification strategy | Covariates (examples) | Notes |
Illegal events per month | Patrol beat | DID (pre/post IFAS vs. matched beats) | Edge share, access, staffing, weekly huddles | Use beat-level panels |
Time-to-closure | Station | Survival models | Device ratio, coverage, meeting cadence | Right-censor long cases |
Convictions per quarter | County | Interrupted time series | Case complexity, prosecutor capacity | Lagged by filing time |
Repeat alerts (≤500 m/90 d) | Grid cell | Matched-pairs | Patrol passes, CFA reporting | Deterrence proxy |
Restoration survival (%) | Closed-case site | Matched plots | Slope, rainfall, species | Follow-up at 6–12 months |
These MEL components create a feedback loop from data to learning to adaptation, allowing IFAS to evolve from a proof-of-concept monitoring platform into a mature governance instrument that can be replicated and scaled in other Kenyan counties and, potentially, in similar forest landscapes in the region.